

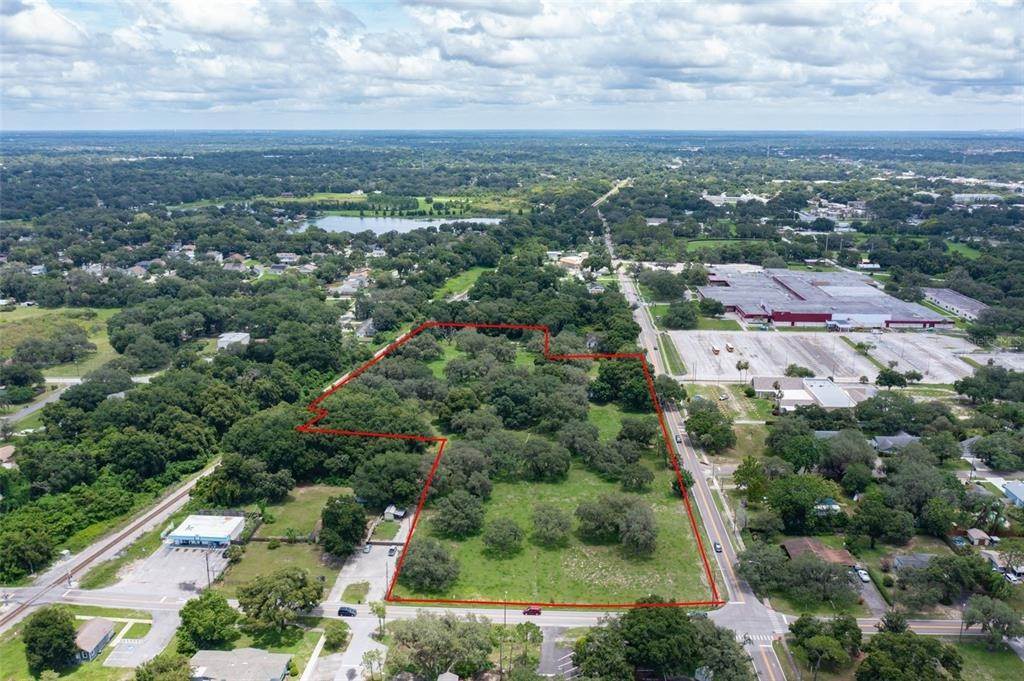
1210 Victoria STREET 1210 Victoria STREET 布兰登, 佛罗里达州 33510 美国


社区向导
按年龄进行的人口细分
This chart indicates the age groups broken down as a percentage of total population in each location.
Household income
This chart indicates the household income grouped by income range as a percentage of total respondent population in each location.
Educational achievement
This chart indicates the educational achievement grouped by level of achievement as a percentage of total respondent population in each location. The national average is indicated in red.
Travel time to work
This chart indicates the total travel time to work grouped by time range in minutes as a percentage of total respondent population in each location.
Time leaving for work
This chart indicates the time leaving for work grouped by time range as a percentage of total respondent population in each location.
Temperature
Precipitation
Year homes built
This chart indicates the year range that homes were built grouped by time span as a percentage of all respondent homes in the selected areas.
Occupancy Status
This pie chart illustrates a breakdown of the occupancy status of homes as a percentage of all respondent homes in the selected areas.
Number Of Occupants
This chart indicates the number of resident occupants in rental dwellings as a percentage of all respondent occupied rental dwellings.
Real Estate Taxes
This chart indicates the real estate taxes paid by a population of respondents in each location grouped by amount range.
Data provided by the U.S. Census Bureau, other government organizations, and local weather stations.
Source : MFRMLS DBA Stellar MLS
Listing Courtesy of KILGORE REAL ESTATE
IDX information is provided exclusively for consumers’ personal, non-commercial use, that it may not be used for any purpose other than to identify prospective properties consumers may be interested in purchasing, and that the data is deemed reliable but is not guaranteed accurate by the MLS. The MLS may, at its discretion, require use of other disclaimers as necessary to protect participants and/or the MLS from liability.
The listing broker’s offer of compensation is made only to participants of the MLS where the listing is filed.